Visualizing Music Trend
D3.js application for analyzing global music trends from 2014–2023.
Overview
My friend and I developed a D3.js music visualization application using the Spotify Tracks Chart Dataset (2014-2023) from Kaggle, which contains around 110,000 entries. The dataset includes categorical variables like track name, release date, and artists, as well as numerical data such as rankings and streams.
My role
I was responsible for building the project structure in HTML and Tailwind CSS, implementing the page layout, and creating all the charts using D3.js. My teammate added additional features, like linking to Wiki pages and refining the bubble chart.
Tech stack
The application was developed using HTML, Tailwind CSS, and module JavaScript within one week. D3.js was used for all data visualizations, enabling rich interactive exploration of the dataset.
Impact
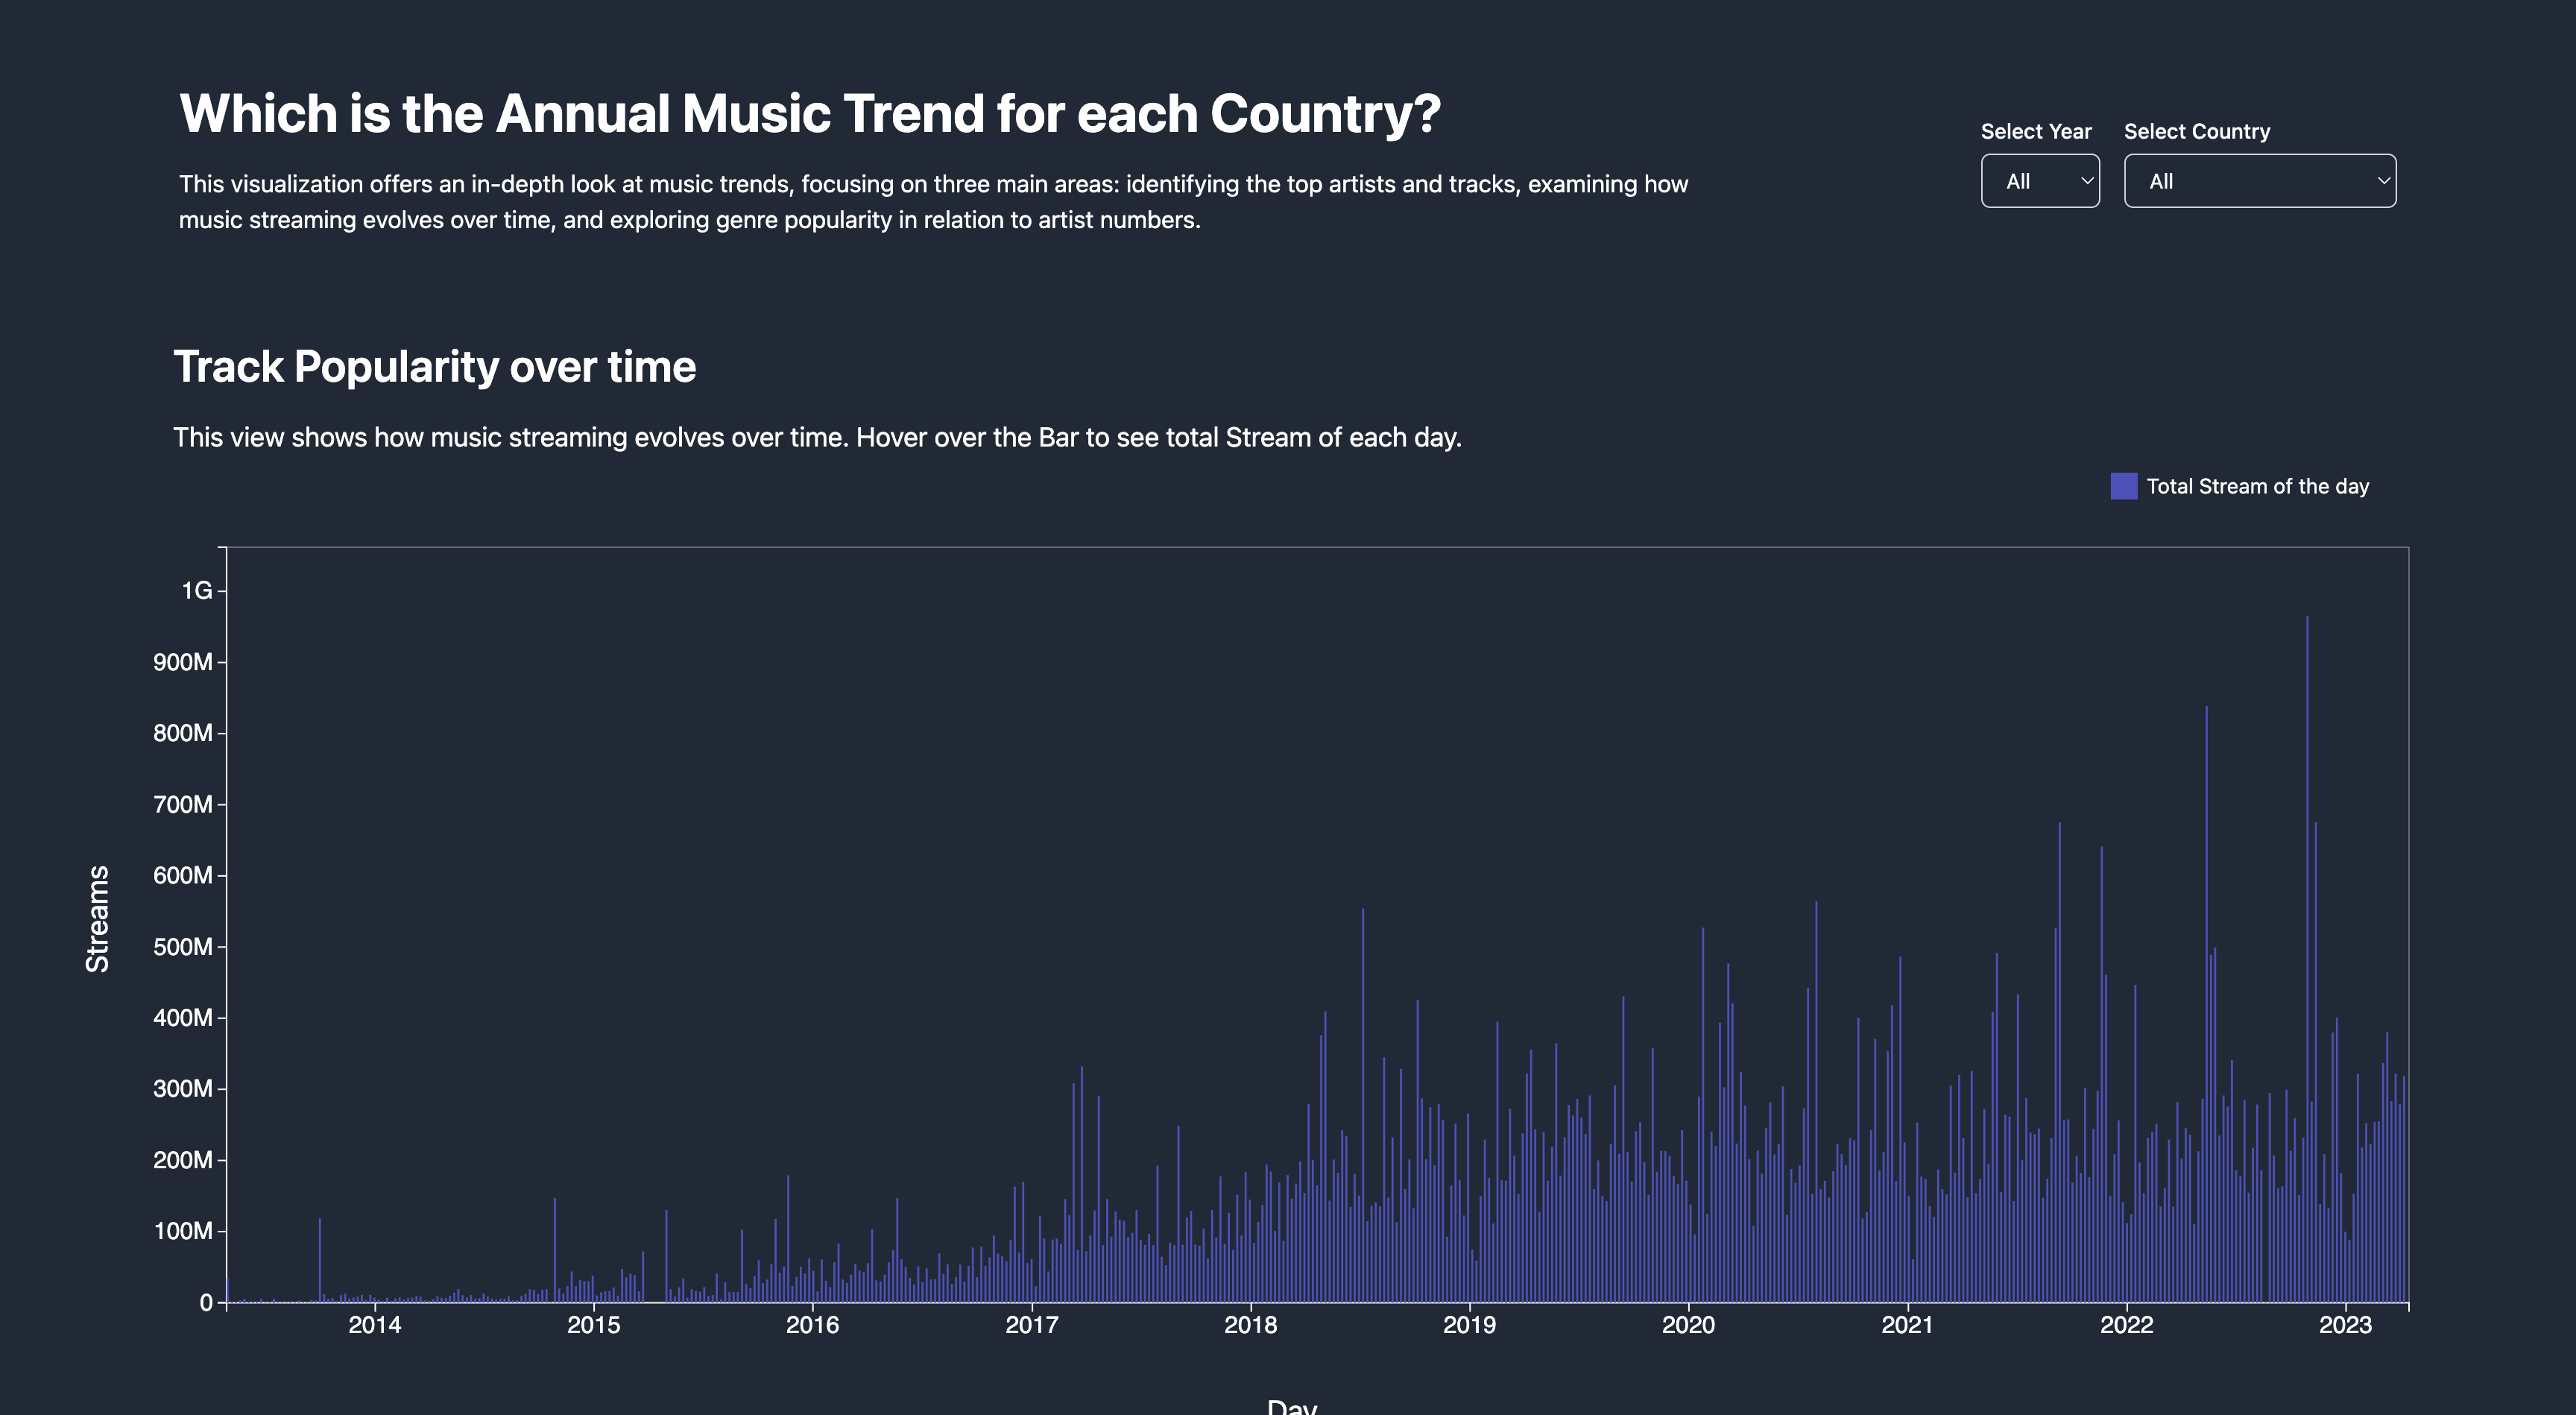
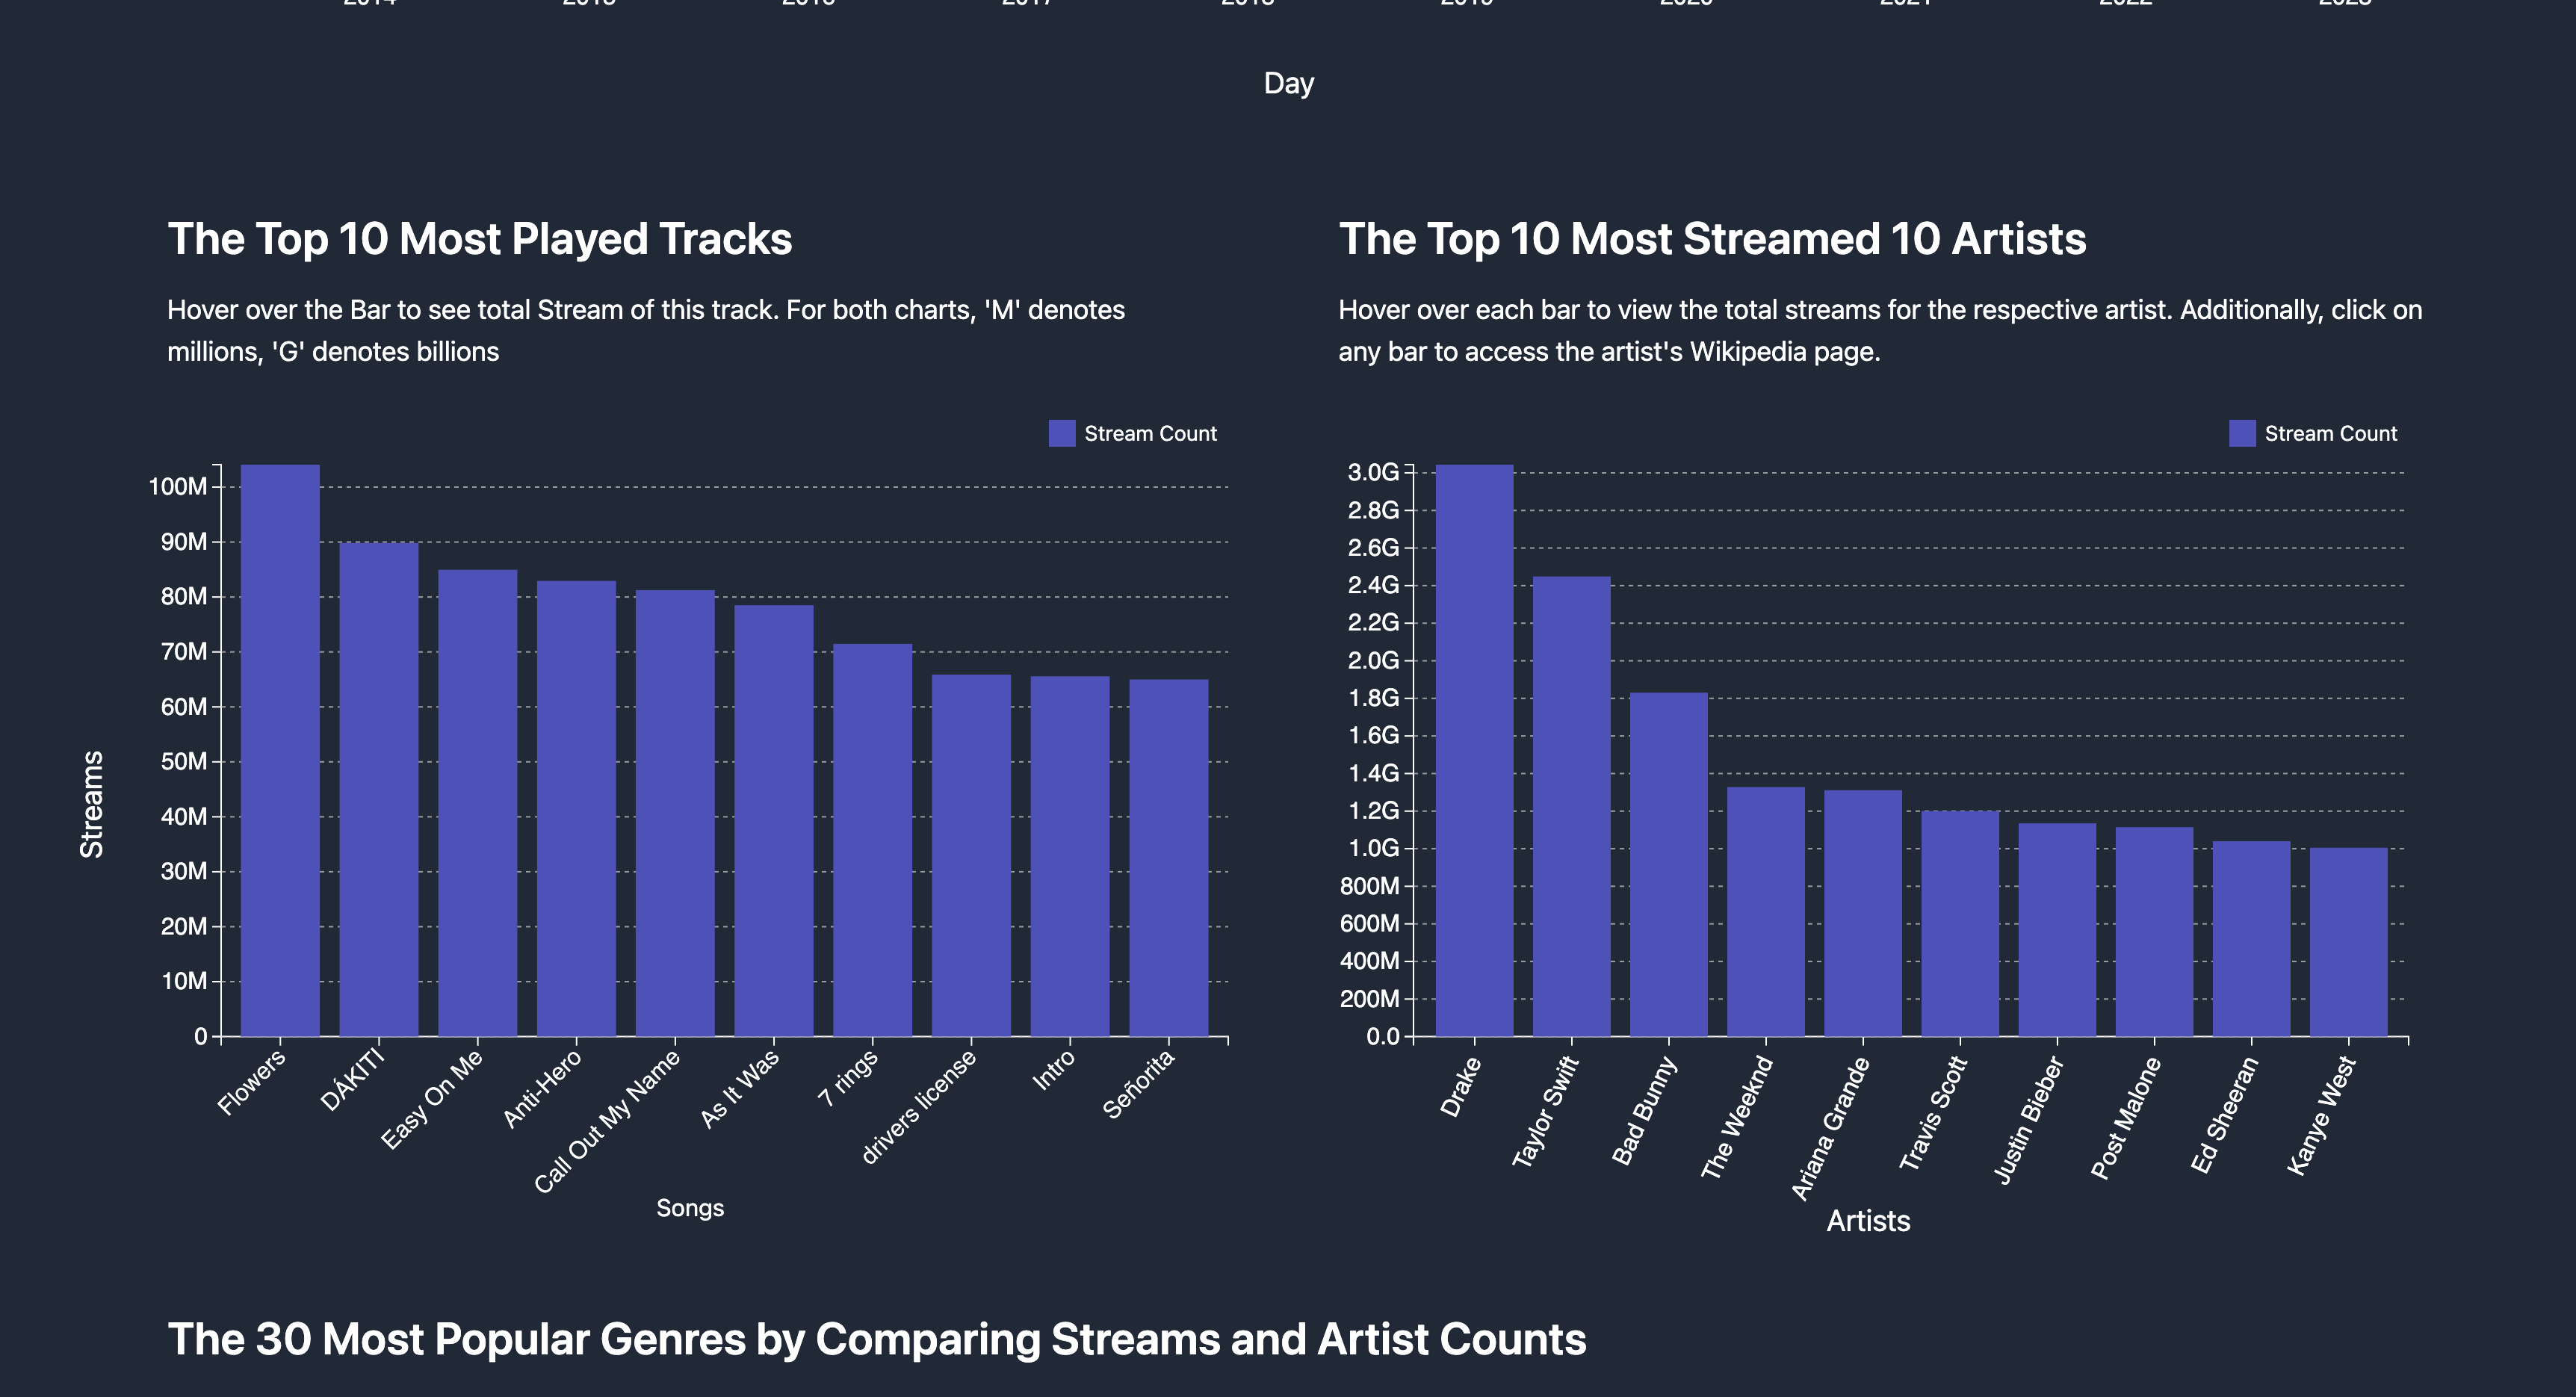
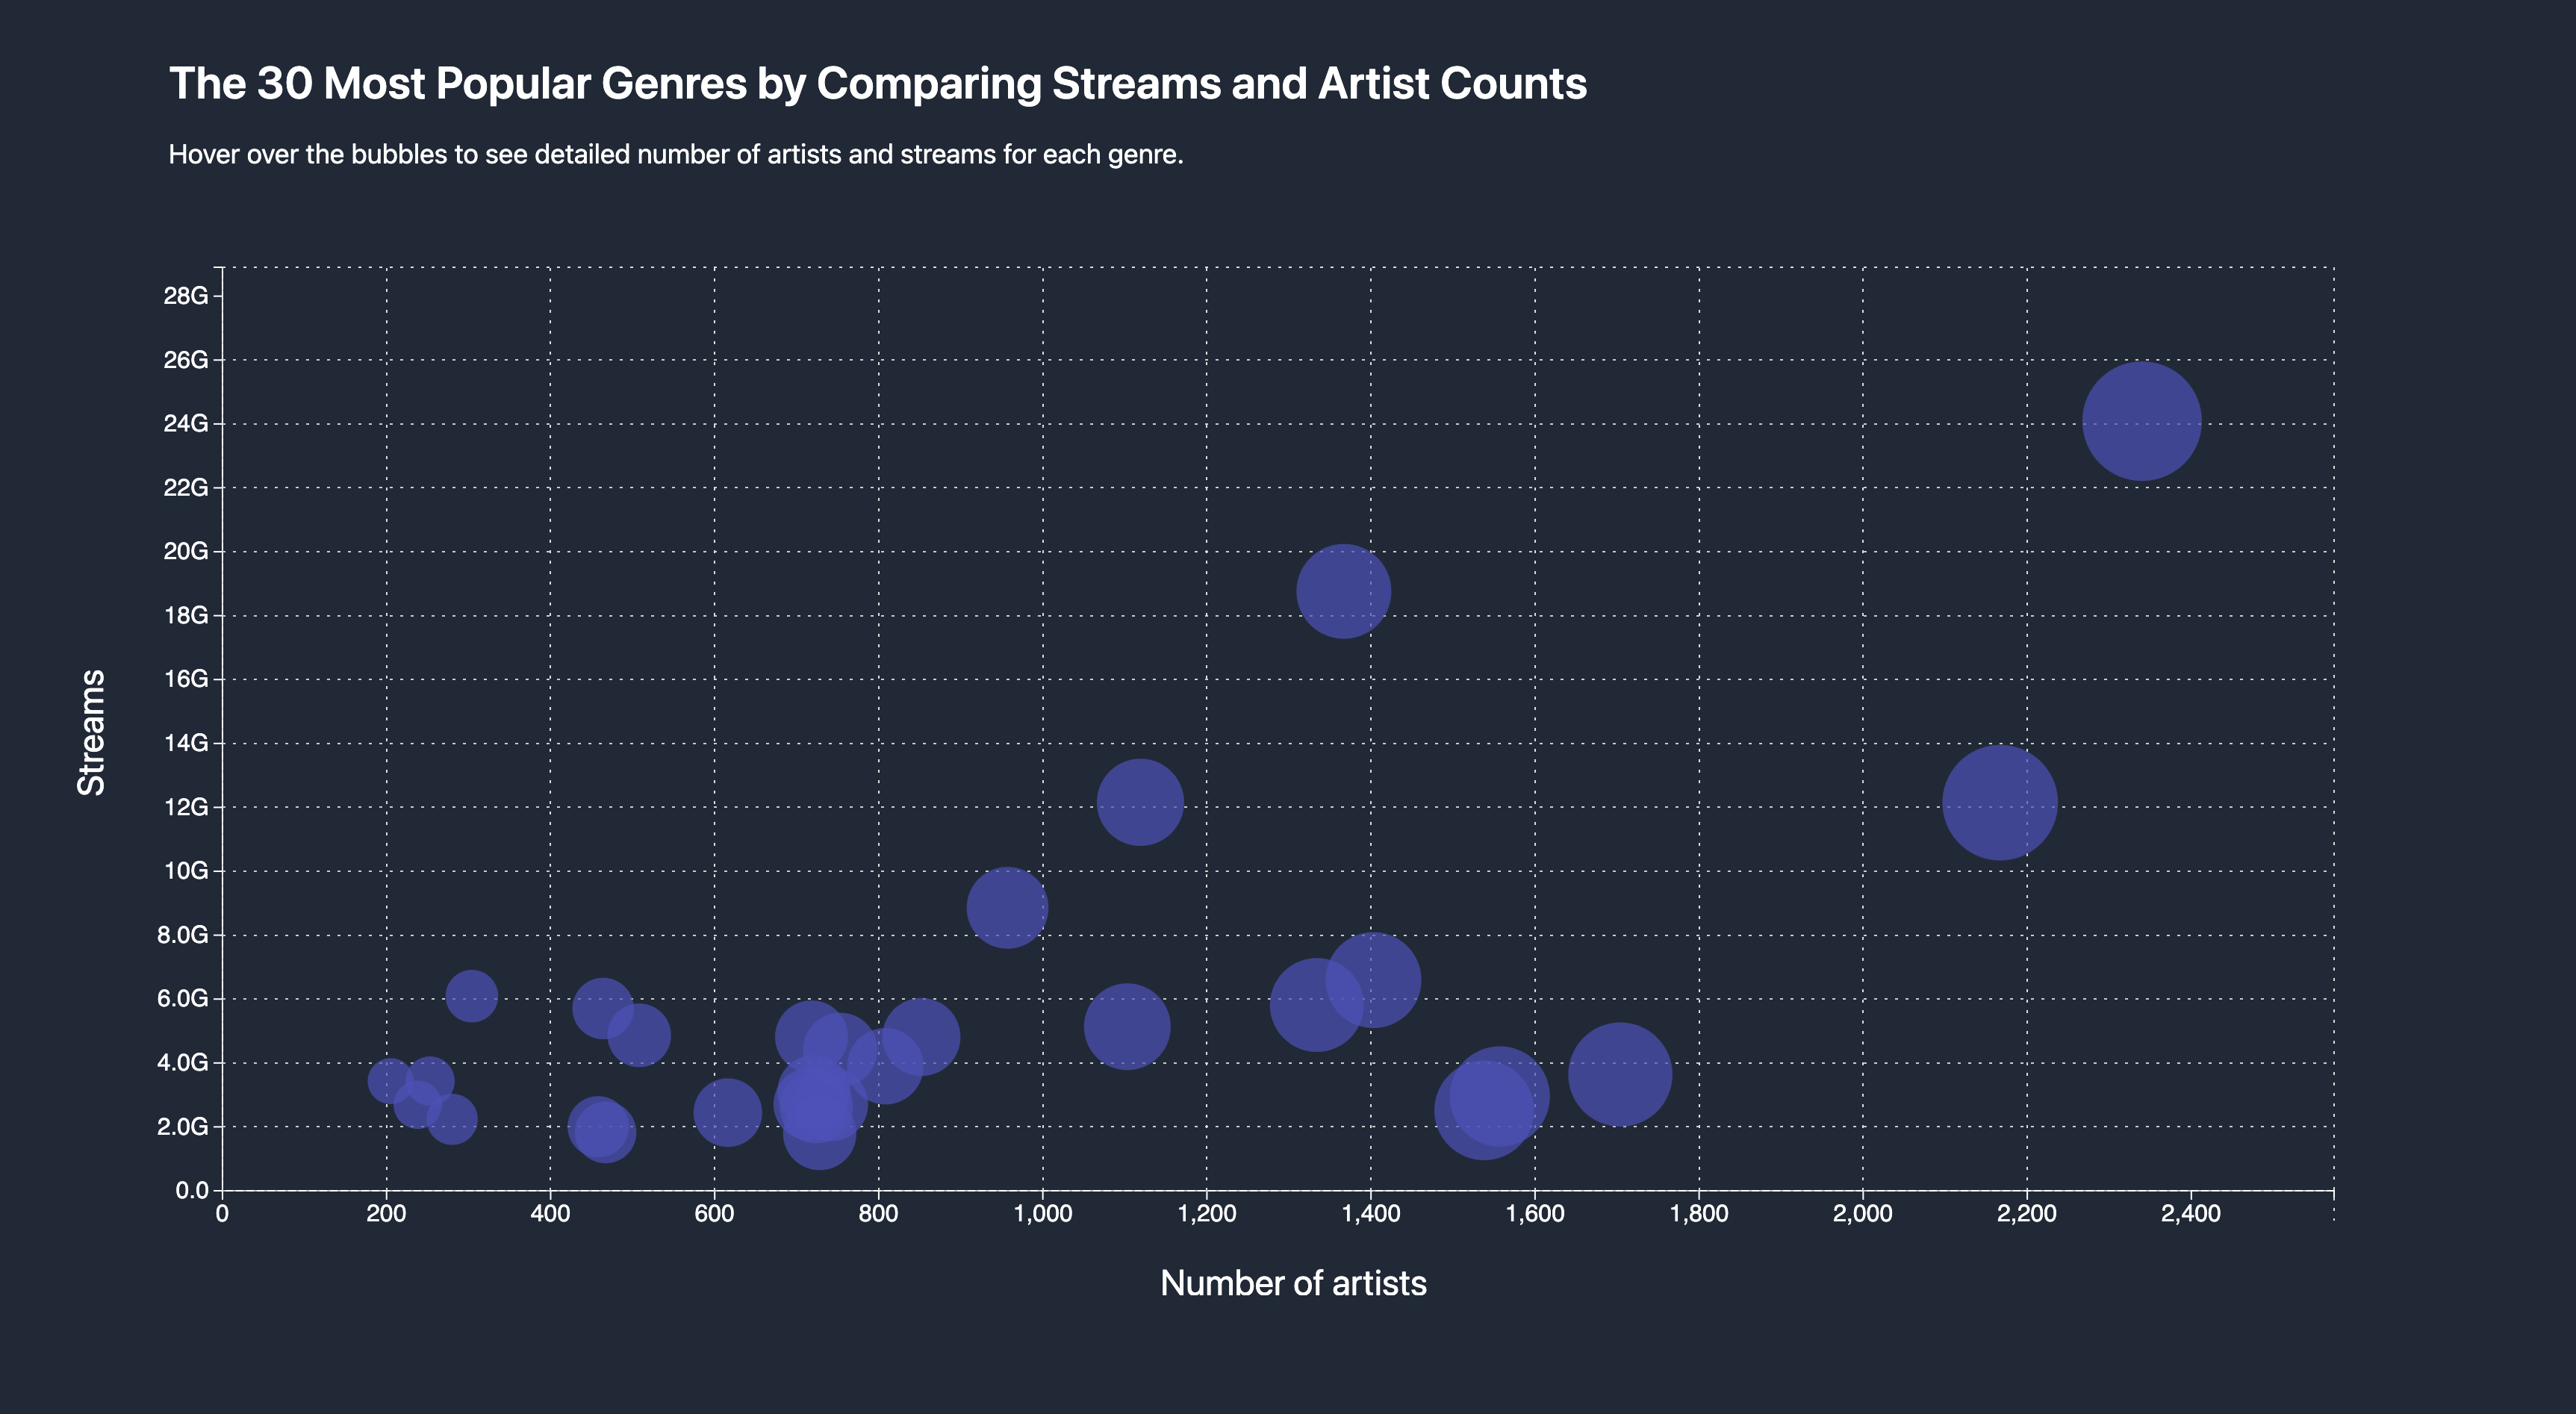
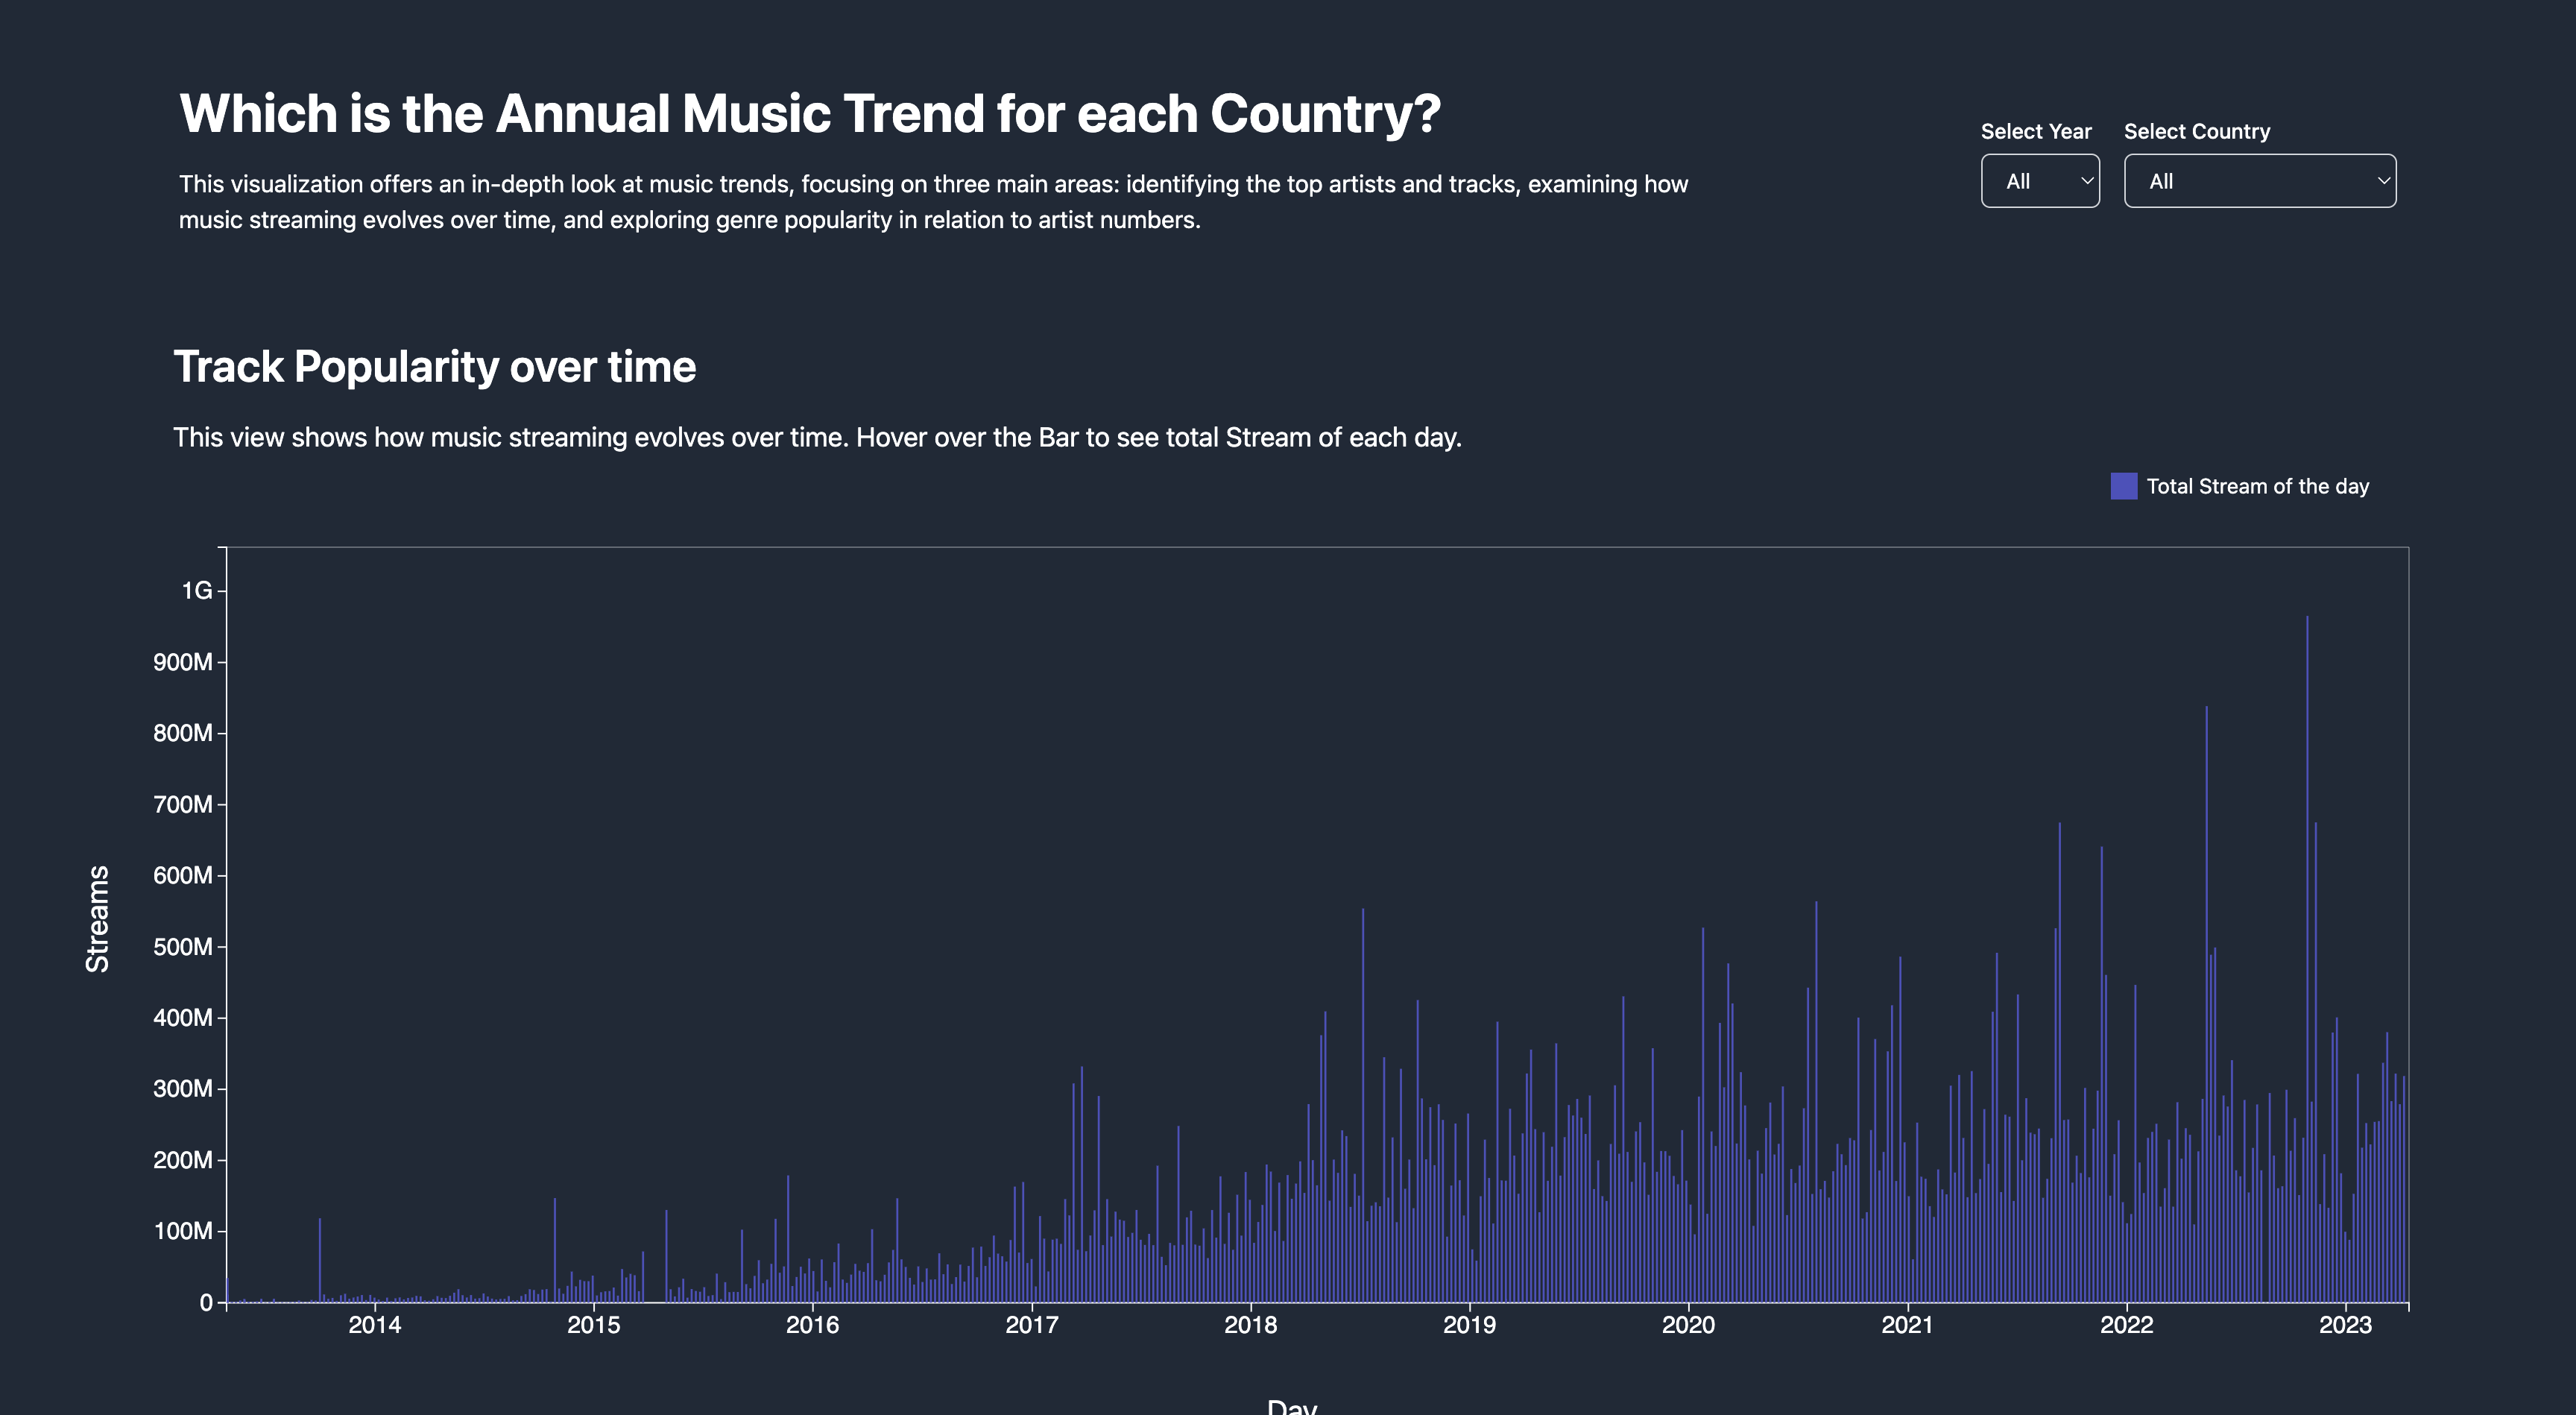
Our application visually analyzes key music trends, addressing questions like which artists consistently rank in the top ten, how music streaming has evolved over time, and what the most popular genres are. This interactive tool helps users explore and understand global music trends over nearly a decade.
Selected screens